How many heatwaves have there been in Royston?
The Meteorological Society (MS) defines a heatwave as when the daily maximum temperature meets or exceeds a certain value for at least three consecutive days. The defining temperature for our area is 28C.
You can see the details at The Meteorological Society
The Sun Hill weather station has been recording data since the start of 2010. During this period there have been 31 heatwaves according to the MS definition.
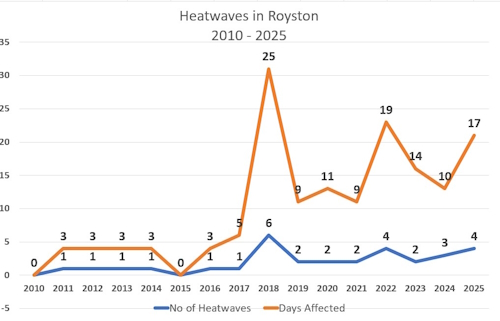
The lower line shows the number of heatwaves for each year. For the first half of the graph there were a couple of years with no heatwave and the rest with one with the minimum span of three days. Things dramatically changed in 2018 with a record six heatwaves. Three of these were in July with two in June and one in August. July 2018 has also the highest average monthly temperature recorded at 21.1C. After 2018 there has been more than one heatwave for each year.
The upper line shows the number of days that were counted in a heatwave in each year. Pre-2018 all but one year the periods were for the minimum three days. Post 2018 the number of days have ben significantly higher with 2025 the third highest even though the year has not yet finished.
In which months do heatwaves occur?
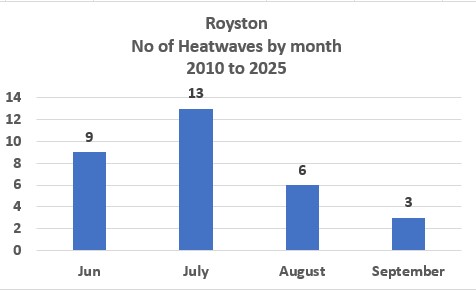
As you would expect the heatwaves are confined to the summer months with July being the most frequent. Interestingly, all of the August heatwaves occurred in or after 2018