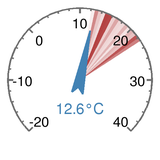
Outside Temperature
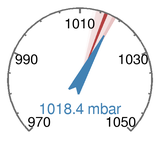
Barometric Pressure
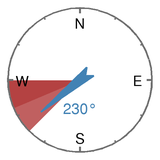
Wind Direction
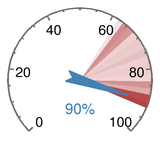
Outside Humidity
Wind Speed
Gust Speed
| First light / Sunrise | 04:19 / 05:05 |
| Sunset / Last light | 21:07 / 21:52 |
| Altitude: | 80 meters |
| Station uptime: | 51 days, 7 hours, 49 minutes |
| Server uptime: | 51 days, 7 hours, 25 minutes |
The gauges
To create the 6 gauges on the left I wrote a general purpose python module which uses the Python Imaging Library (PIL) to render an image of a gauge which can then be saved in png or jpeg format. You can find the latest module here: gauges.py
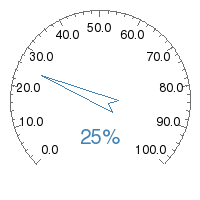
A simple gauge example
import Image
import gauges

im = Image.new("RGB", (200, 200), (255, 255, 255))
g = gauges.GaugeDraw(im, 0, 100)
g.render_simple_gauge(value=25, major_ticks=10, minor_ticks=2, label="25%")
im.save("simple_gauge_example.png", "PNG")
The lines of code above are the easiest way to create a gauge, however they do not draw on a lot of the features available in the module.
Let's go through the code in more detail:
im = Image.new("RGB", (200, 200), (255, 255, 255))
This uses PIL to create a new image called im, 200 x 200 pixels big with a white background (255, 255, 255).
More information on this function can be found here.
g = gauges.GaugeDraw(im, 0, 100)
This creates an instance of the gauge called g.
Mandatory arguments are the minimum and maximum values on the scale, 0 and 100 in this case.
g.render_simple_gauge(value=25, major_ticks=10, minor_ticks=2, label="25%")
Here we use render_simple_gauge which is a helper function to render a simple gauge.
value=25 sets the needle to point to 25. Omitting this value means no needle will be drawn
major_ticks=10 and minor_ticks=2 draws large and small tick marks on the dial at
10 and 2 unit increments. If major_ticks is omitted then no dial will be drawn.
label="25%" adds a label in the middle stating the value the needle is pointing towards. If
this is omitted then no label will be drawn.
im.save("simple_gauge_example.png", "PNG")
The gauge code has now rendered the gauge in the im image buffer. im.save saves the image, however at
this point you are free to use PIL to manipulate the image buffer further.
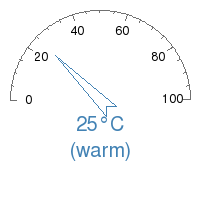
Another simple gauge example
Take a look at this:
import Image
import gauges

im = Image.new("RGB", (200, 200), (255, 255, 255))

g = gauges.GaugeDraw(im, 0, 100, 180)
g.add_needle(25)
g.add_dial(major_ticks=20, minor_ticks=5, dial_format="%d")

degree_sign= u'\N{DEGREE SIGN}'
g.add_text( ("25" + degree_sign + "C", "(warm)") )

g.render()

im.save("another_simple_gauge.png", "PNG")
Instead of using the render_simple_gauge helper function, this code uses the individual setup functions
for each element of the gauge instead. These allow more flexibility in how the gauge is generated.
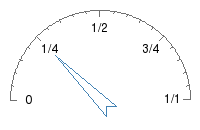
Custom labels
import Image
import gauges

im = Image.new("RGB", (200, 200), (255, 255, 255))

g = gauges.GaugeDraw(im, 0, 100, 180)
g.add_needle(25)
g.add_dial(major_ticks=25, minor_ticks=5, dial_format=None)
g.add_dial_labels({0: '0', 25: '1/4', 50: '1/2', 75: '3/4', 100: '1/1'})
g.render()

im = im.crop((0, 0, 200, 130))
im.save("fuel_gauge.png", "PNG")
Here we prvent the major tick marks being labelled by setting dial_format=None.
add_dial_labels() accepts a dictionary of values and corresponding text labels.
im.crop() is a PIL function which chops off the bottom unused region from the gauge.
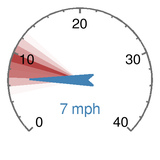
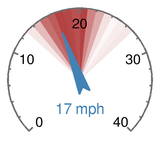
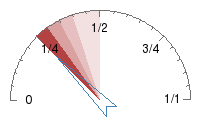
Adding history
The weatherstation gauges give an indication of conditions over the last 24 hours by shading the dial region.
To add shading to the above, use the add_history() function. It accepts a list of values from which it
computes a histogram split over the number of buckets specified.
Add these lines to the code:
history_list = (27, 27.5, 28, 28.5, 29, 29.5, 30, 32, 34, 36, 38, 40, 45)
g.add_history(history_list, num_buckets=20)
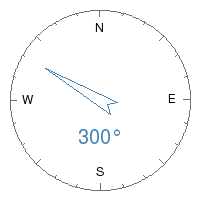
A compass
Here we use offset_angle=180 to rotate the gauge so a value of 0 (North) is at the top. add_dial_labels()
is used to plot the main points of the compass.
import Image
import gauges

degree_sign= u'\N{DEGREE SIGN}'
angle = 300

im = Image.new("RGB", (200, 200), (255, 255, 255))

g = gauges.GaugeDraw(im, 0, 360, dial_range=360, offset_angle=180)
g.add_needle(angle)
g.add_dial(major_ticks=45, minor_ticks=15, dial_format=None)
g.add_dial_labels({0: 'N', 90: 'E', 180: 'S', 270: 'W'})
g.add_text(str(angle) + degree_sign)

g.render()

im.save("compass_gauge.png", "PNG")
Reference
__init__(self, im, min_val, max_val, dial_range=270, background_color=None, offset_angle=0) Initialises the dial.
min_val = minimum value on dial
max_val = maximum value on dial
dial_range = any value between 0 and 360.
360: dial is a complete circle
180: dial is a semicircle
90: dial is a quarter of a complete circle
offset_angle = Change the point in the circle that the gauge begins and ends.self
0: gauge starts and end around the bottom of the image_height
90: the left
180: the top - useful for generating a compass gauge
|
add_dial(self, major_ticks, minor_ticks=None, dial_format='%.1f', dial_font_size=12, dial_font=None, dial_color=None, dial_label_color=None) Configures the background dial major_ticks and minor_ticks are how often to add a tick mark to the dial. Set dial_format to None to stop labelling every major tick mark |
add_dial_labels(self, dial_labels=[], dial_label_font_size=12, dial_label_color=None, dial_label_font=None) Takes a dictionary and draws text at every key.
On a dial from 0 to 360, this dictionary would print the points of the compoass:
{0: 'N', 90: 'E', 180: 'S', 270: 'W'}
|
add_history(self, list_vals, num_buckets, histogram_color=None) Turn list_vals of values into a histogram |
add_needle(self, value, needle_outline_color=None, needle_fill_color=None) Draws a needle pointing towards value. needle_outline_color overrides the default |
add_text(self, text_list=None, text_font_size=20, text_font=None, text_color=None) Adds multiple lines of text as a caption. Usually used to display the value of the gauge. If label_list is not set, will create a single line label based on the value the needle is pointing to (only works if add_needle function has already been called). |
render(self) Renders the gauge. Call this function last. |
render_simple_gauge(self, value=None, major_ticks=None, minor_ticks=None, label=None, font=None) Helper function to create gauges with minimal code, eg:
import Image
import gauges
im = Image.new("RGB", (200, 200), (255, 255, 255))
g = gauges.GaugeDraw(im, 0, 100)
g.render_simple_gauge(value=25, major_ticks=10, minor_ticks=2, label="25")
im.save("simple_gauge_image.png", "PNG")
Does not support dial labels, histogram dial background or setting colors.
|